bartools: scRNA-seq analysis guide
Henrietta Holze
September 05, 2023
bartools_single_cell_analysis.RmdBartools single-cell guide
The bartools package contains methods to simplify clone
level analyses from single-cell cellular barcoding datasets. The purpose
of this vignette is to highlight these capabilities of
bartools.
0. Setup
This vignette makes use of a simple test single cell experiment
object (SCE) included in the bartools package. The dataset
contains 100 cells each with 100 randomly sampled genes. Each cell has
lineage barcode information annotated in the
test.sce$barcode field.
Dimensionality reduction and clustering were previously performed
using Seurat. Cluster assignments are in the
test.sce$seurat_clusters field.
Load the bartools package
library(bartools)## Loading required package: edgeR## Loading required package: limma## Loading required package: ggplot2
knitr::opts_chunk$set(dev="png")Load the test.sce dataset
data(test.sce)
test.sce
## Loading required package: SingleCellExperiment## Loading required package: SummarizedExperiment## Loading required package: MatrixGenerics## Loading required package: matrixStats##
## Attaching package: 'MatrixGenerics'## The following objects are masked from 'package:matrixStats':
##
## colAlls, colAnyNAs, colAnys, colAvgsPerRowSet, colCollapse,
## colCounts, colCummaxs, colCummins, colCumprods, colCumsums,
## colDiffs, colIQRDiffs, colIQRs, colLogSumExps, colMadDiffs,
## colMads, colMaxs, colMeans2, colMedians, colMins, colOrderStats,
## colProds, colQuantiles, colRanges, colRanks, colSdDiffs, colSds,
## colSums2, colTabulates, colVarDiffs, colVars, colWeightedMads,
## colWeightedMeans, colWeightedMedians, colWeightedSds,
## colWeightedVars, rowAlls, rowAnyNAs, rowAnys, rowAvgsPerColSet,
## rowCollapse, rowCounts, rowCummaxs, rowCummins, rowCumprods,
## rowCumsums, rowDiffs, rowIQRDiffs, rowIQRs, rowLogSumExps,
## rowMadDiffs, rowMads, rowMaxs, rowMeans2, rowMedians, rowMins,
## rowOrderStats, rowProds, rowQuantiles, rowRanges, rowRanks,
## rowSdDiffs, rowSds, rowSums2, rowTabulates, rowVarDiffs, rowVars,
## rowWeightedMads, rowWeightedMeans, rowWeightedMedians,
## rowWeightedSds, rowWeightedVars## Loading required package: GenomicRanges## Loading required package: stats4## Loading required package: BiocGenerics##
## Attaching package: 'BiocGenerics'## The following object is masked from 'package:limma':
##
## plotMA## The following objects are masked from 'package:stats':
##
## IQR, mad, sd, var, xtabs## The following objects are masked from 'package:base':
##
## anyDuplicated, aperm, append, as.data.frame, basename, cbind,
## colnames, dirname, do.call, duplicated, eval, evalq, Filter, Find,
## get, grep, grepl, intersect, is.unsorted, lapply, Map, mapply,
## match, mget, order, paste, pmax, pmax.int, pmin, pmin.int,
## Position, rank, rbind, Reduce, rownames, sapply, setdiff, sort,
## table, tapply, union, unique, unsplit, which.max, which.min## Loading required package: S4Vectors##
## Attaching package: 'S4Vectors'## The following objects are masked from 'package:base':
##
## expand.grid, I, unname## Loading required package: IRanges## Loading required package: GenomeInfoDb## Loading required package: Biobase## Welcome to Bioconductor
##
## Vignettes contain introductory material; view with
## 'browseVignettes()'. To cite Bioconductor, see
## 'citation("Biobase")', and for packages 'citation("pkgname")'.##
## Attaching package: 'Biobase'## The following object is masked from 'package:MatrixGenerics':
##
## rowMedians## The following objects are masked from 'package:matrixStats':
##
## anyMissing, rowMedians##
## Attaching package: 'SingleCellExperiment'## The following object is masked from 'package:edgeR':
##
## cpm## class: SingleCellExperiment
## dim: 100 100
## metadata(0):
## assays(3): counts logcounts scaledata
## rownames(100): Mrpl15 Lypla1 ... Tmem131 Cnga3
## rowData names(0):
## colnames(100): GCTACCTAGAGGCCAT ACTGCAAGTGATTCAC ... CGAGTTACAGCGACAA
## TTTATGCGTACAGTTC
## colData names(27): orig.ident nCount_RNA ... seurat_clusters ident
## reducedDimNames(3): PCA TSNE UMAP
## mainExpName: RNA
## altExpNames(1): HTO1. Analyse dataset metrics using plotMetrics
Single cell RNA sequencing datasets can reveal transcriptional
differences between groups of cells / celltypes that are of biological
importance. The plotMetrics function takes a single cell
object in Seurat or SingleCellExperiment format and plots a desired
continuous variable (e.g. number of transcripts or genes detected per
cell) split across any groups of interest. These groups could be
clusters, celltypes or, with lineage barcode information, individual
clones. Thus, plotMetrics allows us to go one step further
and examine biological differences between individual groups of
cells.
Here, the group parameter defines a grouping variable,
present as a column of metadata in the single cell object. the
factor parameter defines a continuous variable to plot per
level of the group parameter. the threshold
parameter defines the minimum number of cells required for each level of
the group parameter.
plotMetrics - clusters
plotMetrics(test.sce, group = "seurat_clusters", factor = "nCount_RNA", threshold = 10)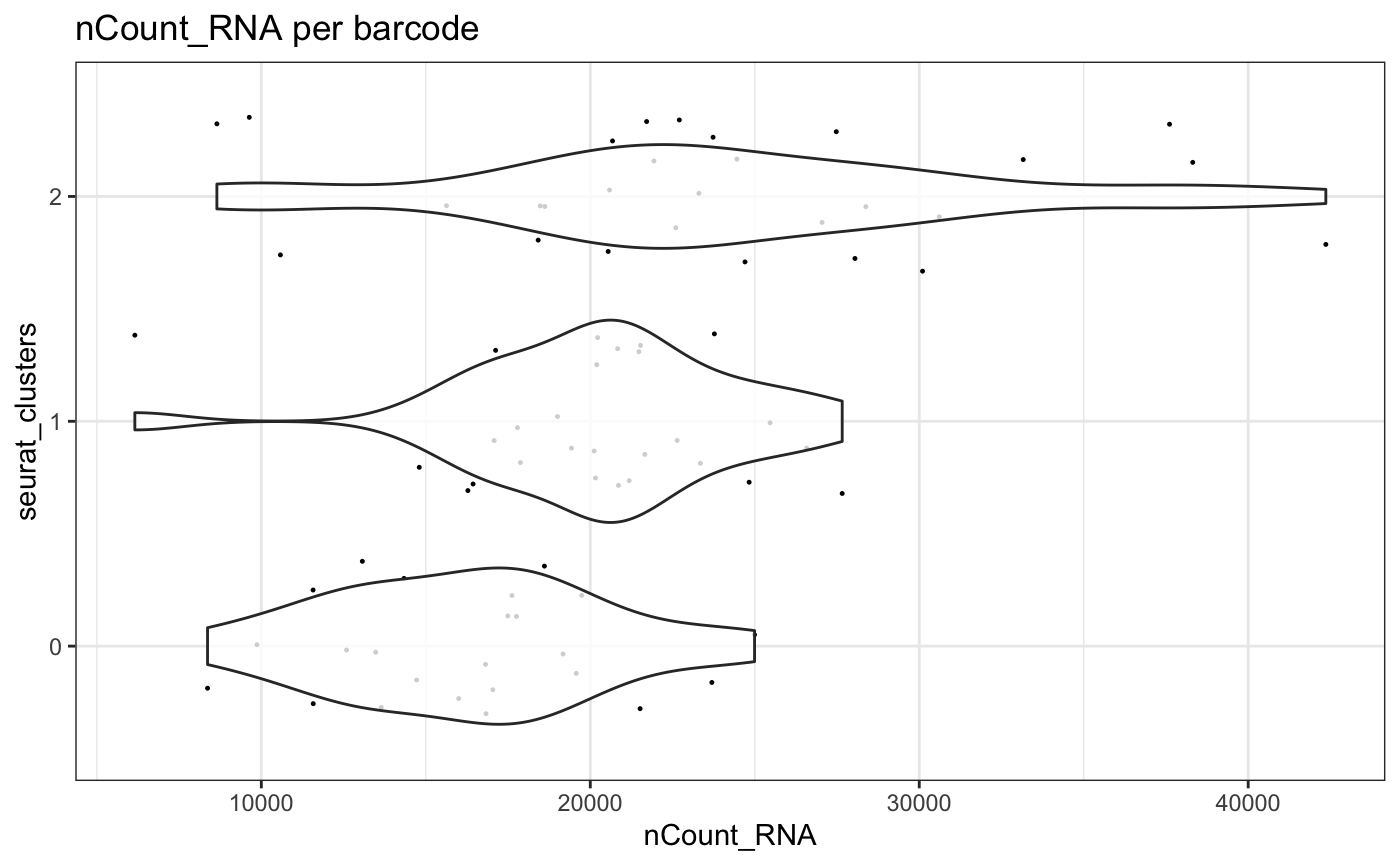 Using the
 trans parameter, the x axis in
plotMetrics can be transformed using standard methods
available within R
plotMetrics(test.sce, group = "seurat_clusters", factor = "nCount_RNA", threshold = 10, trans = "log10")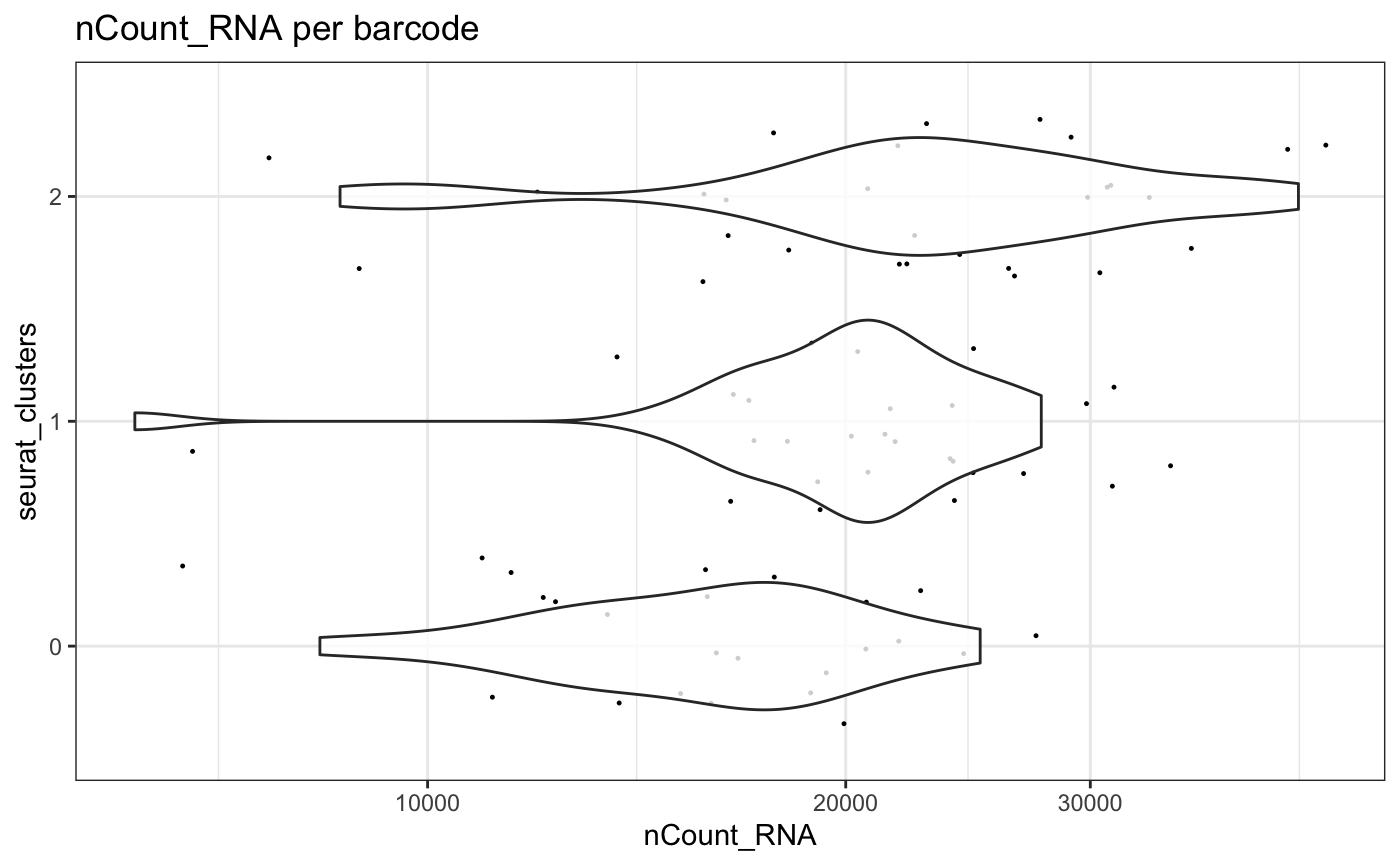
plotMetrics - barcodes
plotMetrics accepts any grouping variable available in
the sample metadata. Here we examine transcriptional differences between
clones using lineage barcode information.
NB: In this test dataset the number of cells per clone is small.
plotMetrics(test.sce, group = "barcode", factor = "nCount_RNA", threshold = 2)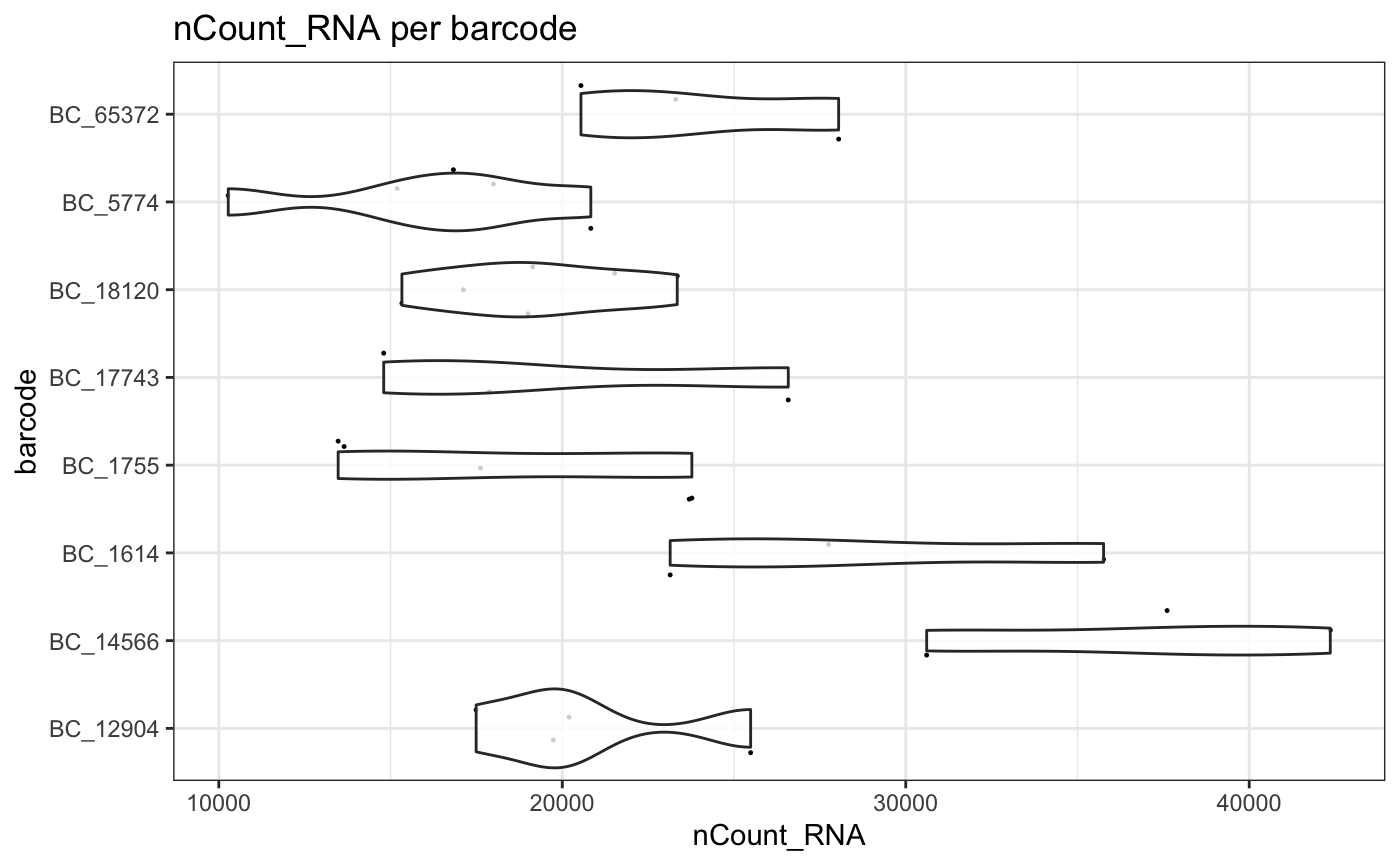
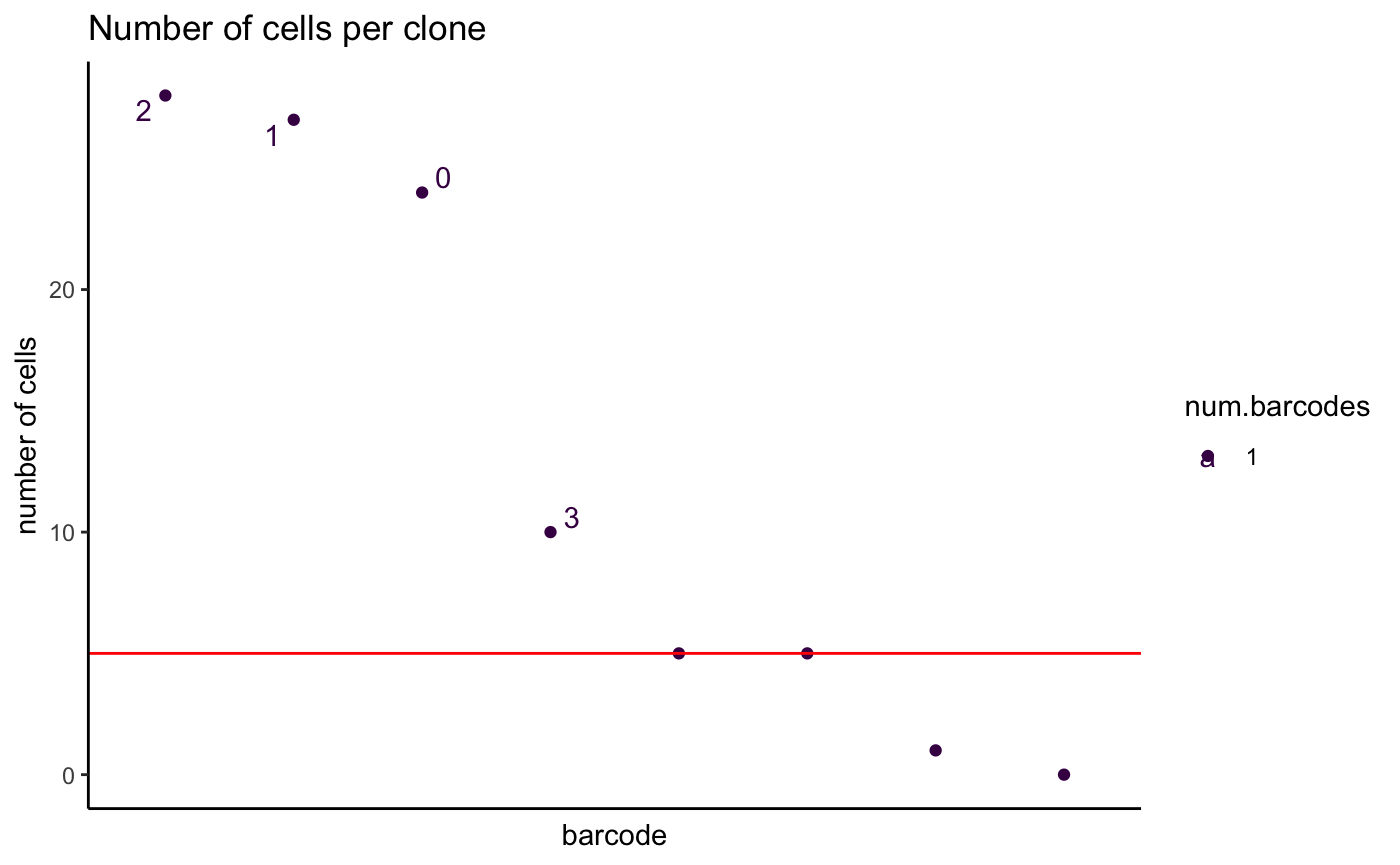
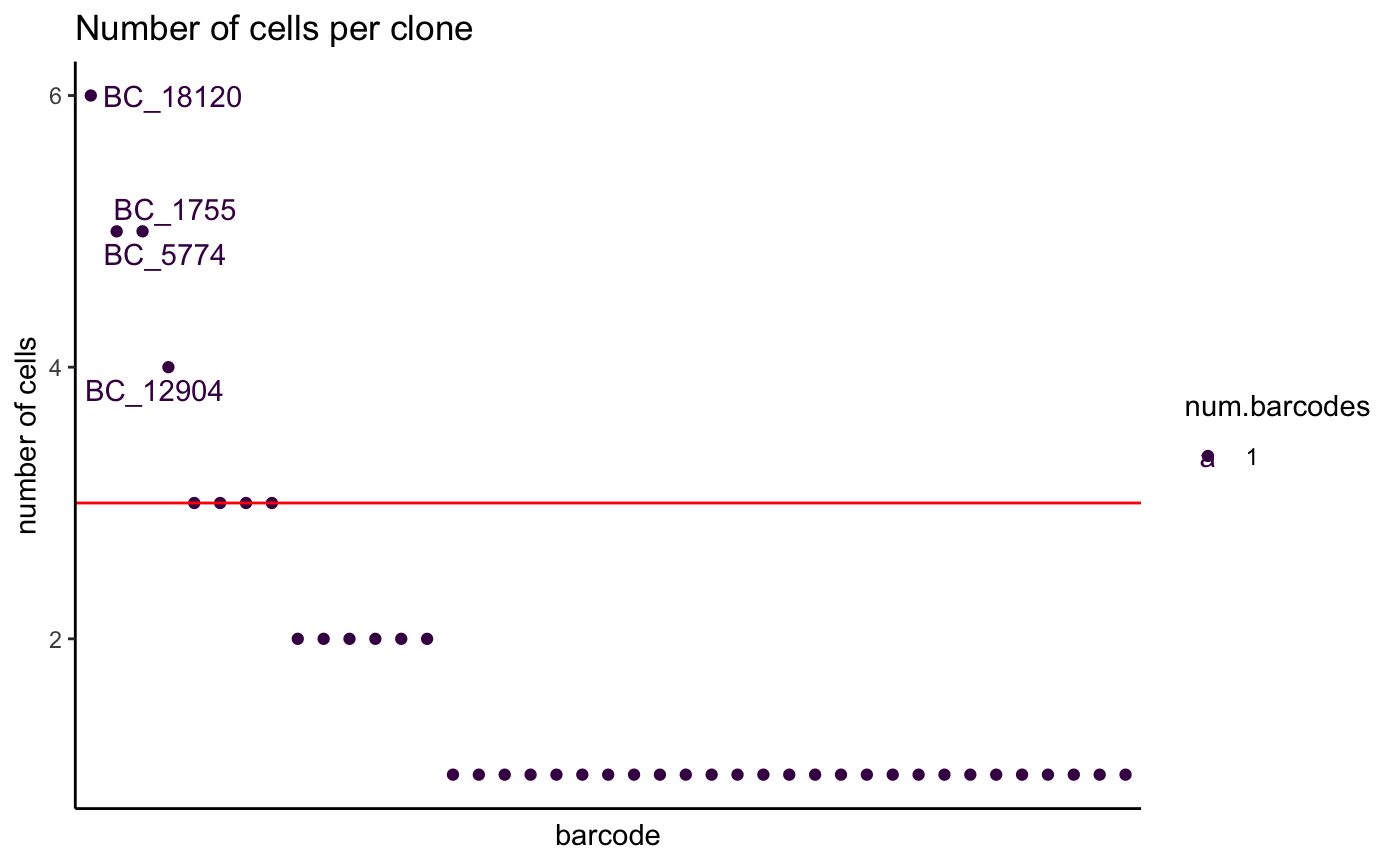
2. Examine number of cells per grouping variable - plotCellsPerGroup
We may also be interested in basic metrics like how many cells
comprise a grouping variable of interest such as cluster, celltype or
lineage barcode. The plotCellsPerGroup function allows this
to be easily plotted.
Groups above a user defined threshold are highlighted.
Here, the group parameter defines a grouping variable,
present as a column of metadata in the single cell object. the
threshold parameter defines the minimum number of cells.
Levels of the group parameter above this threshold will be
labelled.
3. Plot distribution of cells across clusters - plotCellsInClusters
We may also be interested in the distribution of cells within certain
groups across levels of another group. For example we may want to reveal
the proportion of cells in a certain cell cycle phase across louvain
clusters within a single cell dataset. The
plotCellsInClusters function allows users to examine these
questions.
Here, the group parameter defines a grouping variable,
present as a column of metadata in the single cell object. the
factor parameter defines a level of group to
calculate percentage abundance within each level of idents.
the idents parameter defines a second grouping variable,
present as a column of metadata in the single cell object.
Cell cycle phase across clusters
plotCellsInClusters(test.sce, group = "Phase", factor = "G1", clusters = "seurat_clusters")## # A tibble: 7 × 2
## seurat_clusters n
## <fct> <int>
## 1 0 17
## 2 1 15
## 3 2 15
## 4 3 6
## 5 4 4
## 6 5 3
## 7 7 1## Warning in ggplot2::geom_histogram(stat = "identity"): Ignoring unknown
## parameters: `binwidth`, `bins`, and `pad`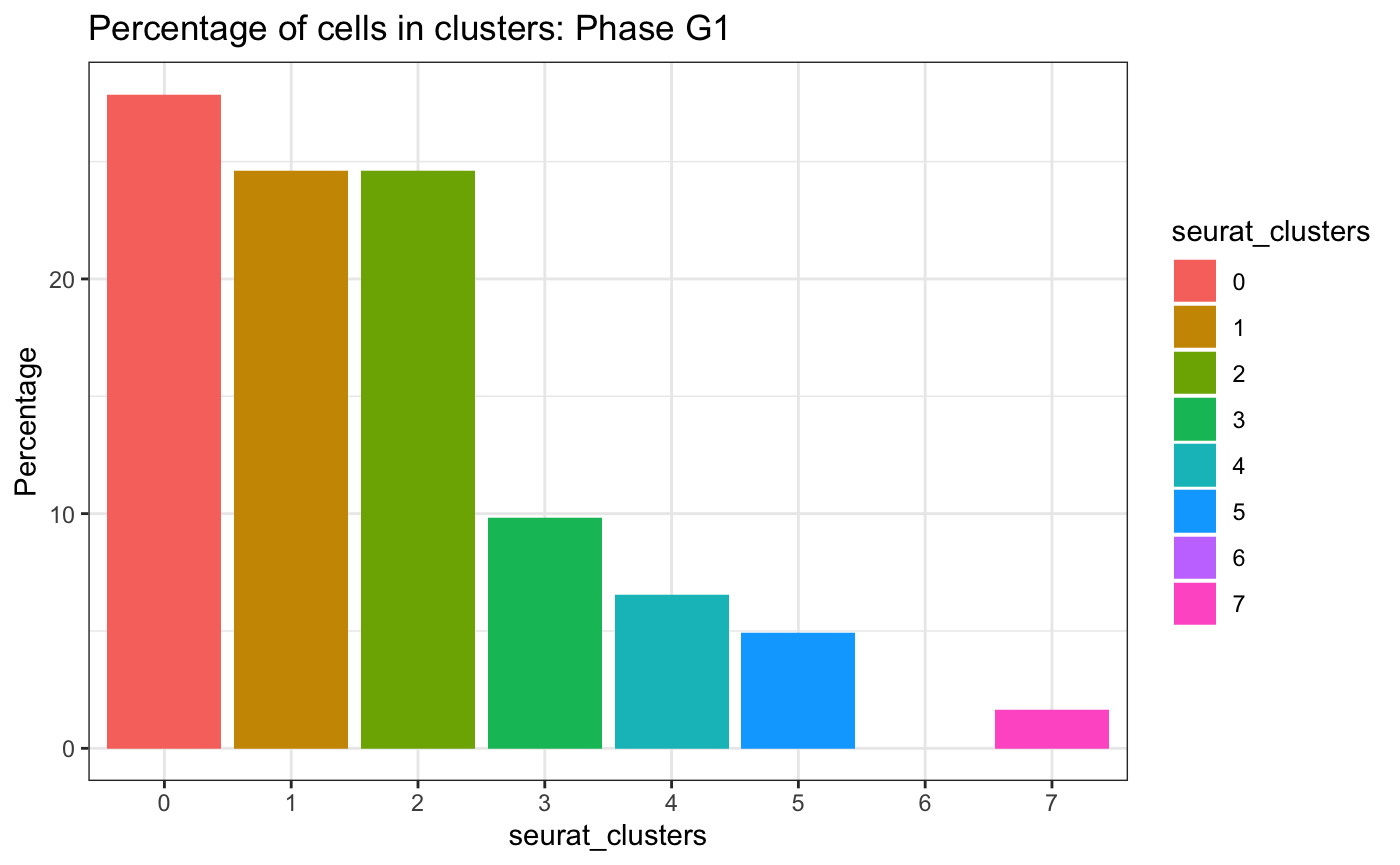
The plotCellsInClusters framework can extend to any
discrete variables present in the dataset. Here we examine the
representation of lineage barcode BC_12904 across clusters
plotCellsInClusters(test.sce, group = "barcode", factor = "BC_12904", clusters = "seurat_clusters")## # A tibble: 3 × 2
## seurat_clusters n
## <fct> <int>
## 1 0 2
## 2 1 1
## 3 7 1## Warning in ggplot2::geom_histogram(stat = "identity"): Ignoring unknown
## parameters: `binwidth`, `bins`, and `pad`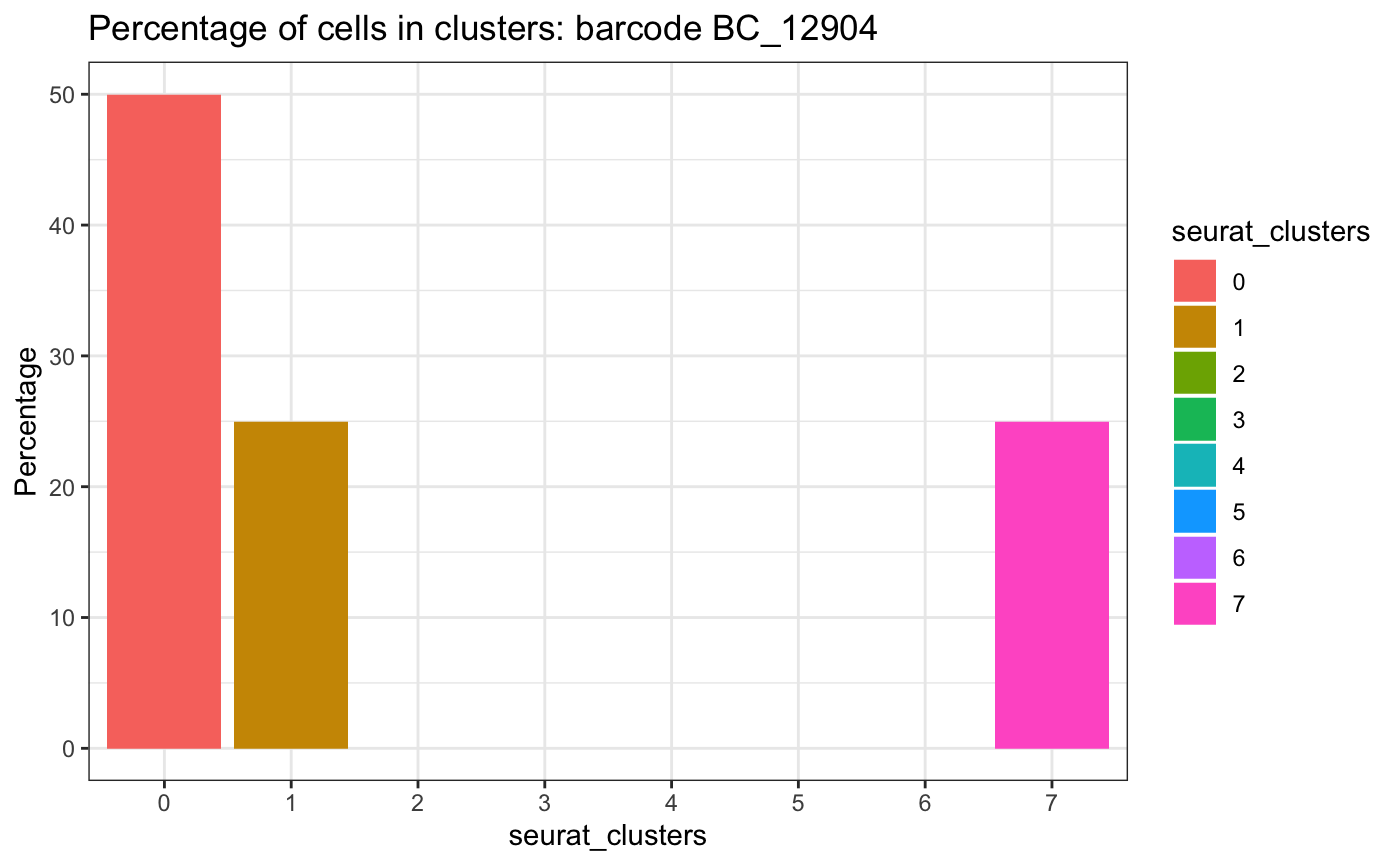
4. Determine enrichment within clusters - plotClusterEnrichment
To check whether a clone is enriched in a cluster or cell type, we
can perform a hypergeometric test using the
plotClusterEnrichment function. Here we test for enrichment
of cells in G2M cell cycle phase across louvain clusters.
Here, the group parameter defines a grouping variable,
present as a column of metadata in the single cell object. the
factor parameter defines a level of the group
parameter to test for enrichment within each level of
idents. the idents parameter defines a second
grouping variable to test for enrichment of factor at each
level. the threshold parameter defines a p-value threshold
for the hypergeometric test.
plotClusterEnrichment(
  test.sce,
  group = "Phase",
  factor = "G2M",
  clusters = "seurat_clusters",
  threshold = 0.01,
  order = T,
  plot = T
)
## The following ident levels had no observations and were removed: 6## ---## cluster_0## all cells: 100## all G2M cells: 2## universe: 98## cluster total cells: 24## cluster G2M cells: 0## [1] "Hypergeometric test p-value: 0.424242424242424"## ---## cluster_1## all cells: 100## all G2M cells: 2## universe: 98## cluster total cells: 27## cluster G2M cells: 0## [1] "Hypergeometric test p-value: 0.469090909090909"## ---## cluster_2## all cells: 100## all G2M cells: 2## universe: 98## cluster total cells: 28## cluster G2M cells: 1## [1] "Hypergeometric test p-value: 0.0763636363636364"## ---## cluster_3## all cells: 100## all G2M cells: 2## universe: 98## cluster total cells: 10## cluster G2M cells: 1## [1] "Hypergeometric test p-value: 0.0090909090909091"## ---## cluster_4## all cells: 100## all G2M cells: 2## universe: 98## cluster total cells: 5## cluster G2M cells: 0## [1] "Hypergeometric test p-value: 0.0979797979797982"## ---## cluster_5## all cells: 100## all G2M cells: 2## universe: 98## cluster total cells: 5## cluster G2M cells: 0## [1] "Hypergeometric test p-value: 0.0979797979797982"## ---## cluster_7## all cells: 100## all G2M cells: 2## universe: 98## cluster total cells: 1## cluster G2M cells: 0## [1] "Hypergeometric test p-value: 0.0200000000000001"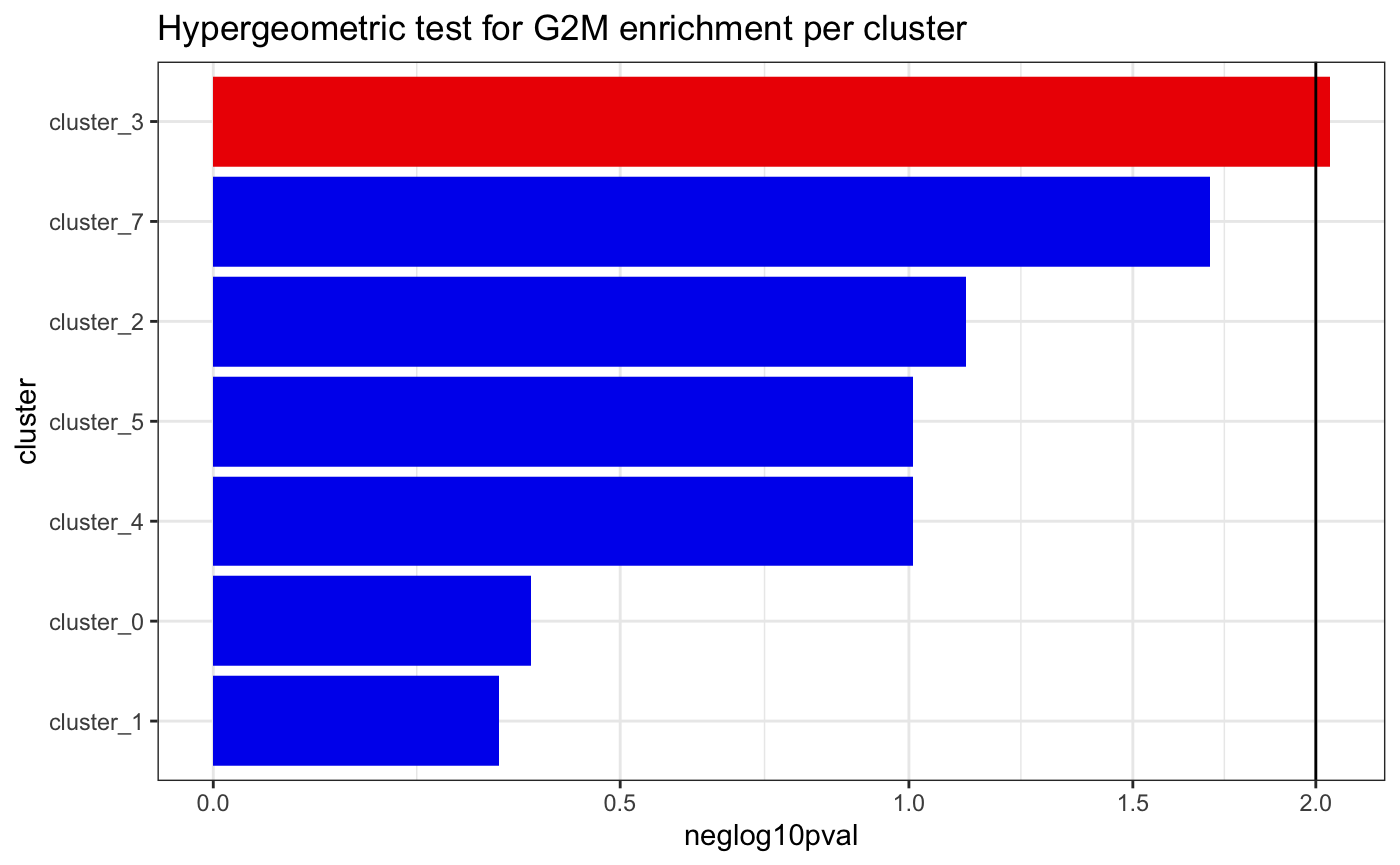 ## 5. Session Info
## R version 4.2.2 (2022-10-31)
## Platform: aarch64-apple-darwin20 (64-bit)
## Running under: macOS 14.1.1
##
## Matrix products: default
## BLAS:   /Library/Frameworks/R.framework/Versions/4.2-arm64/Resources/lib/libRblas.0.dylib
## LAPACK: /Library/Frameworks/R.framework/Versions/4.2-arm64/Resources/lib/libRlapack.dylib
##
## locale:
## [1] en_US.UTF-8/en_US.UTF-8/en_US.UTF-8/C/en_US.UTF-8/en_US.UTF-8
##
## attached base packages:
## [1] stats4    stats     graphics  grDevices utils     datasets  methods
## [8] base
##
## other attached packages:
##  [1] SingleCellExperiment_1.20.1 SummarizedExperiment_1.28.0
##  [3] Biobase_2.58.0              GenomicRanges_1.50.2
##  [5] GenomeInfoDb_1.34.9         IRanges_2.32.0
##  [7] S4Vectors_0.36.2            BiocGenerics_0.44.0
##  [9] MatrixGenerics_1.10.0       matrixStats_1.0.0
## [11] bartools_1.0.0              ggplot2_3.4.4
## [13] edgeR_3.40.2                limma_3.54.2
##
## loaded via a namespace (and not attached):
##  [1] viridis_0.6.4          sass_0.4.7             viridisLite_0.4.2
##  [4] jsonlite_1.8.7         splines_4.2.2          bslib_0.6.0
##  [7] highr_0.10             GenomeInfoDbData_1.2.9 ggrepel_0.9.4
## [10] yaml_2.3.7             pillar_1.9.0           lattice_0.21-9
## [13] glue_1.6.2             digest_0.6.33          XVector_0.38.0
## [16] colorspace_2.1-0       htmltools_0.5.7        Matrix_1.6-1.1
## [19] pkgconfig_2.0.3        zlibbioc_1.44.0        purrr_1.0.2
## [22] scales_1.2.1           tibble_3.2.1           mgcv_1.9-0
## [25] farver_2.1.1           generics_0.1.3         cachem_1.0.8
## [28] withr_2.5.2            cli_3.6.1              magrittr_2.0.3
## [31] memoise_2.0.1          evaluate_0.23          fs_1.6.3
## [34] fansi_1.0.5            nlme_3.1-163           MASS_7.3-60
## [37] vegan_2.6-4            textshaping_0.3.6      tools_4.2.2
## [40] ineq_0.2-13            lifecycle_1.0.4        stringr_1.5.1
## [43] munsell_0.5.0          locfit_1.5-9.8         DelayedArray_0.24.0
## [46] cluster_2.1.4          compiler_4.2.2         pkgdown_2.0.7
## [49] jquerylib_0.1.4        systemfonts_1.0.5      rlang_1.1.2
## [52] grid_4.2.2             RCurl_1.98-1.12        rstudioapi_0.15.0
## [55] labeling_0.4.3         bitops_1.0-7           rmarkdown_2.25
## [58] gtable_0.3.4           R6_2.5.1               gridExtra_2.3
## [61] knitr_1.45             dplyr_1.1.4            fastmap_1.1.1
## [64] utf8_1.2.4             rprojroot_2.0.4        ragg_1.2.5
## [67] permute_0.9-7          desc_1.4.2             stringi_1.8.1
## [70] parallel_4.2.2         Rcpp_1.0.11            vctrs_0.6.4
## [73] tidyselect_1.2.0       xfun_0.41