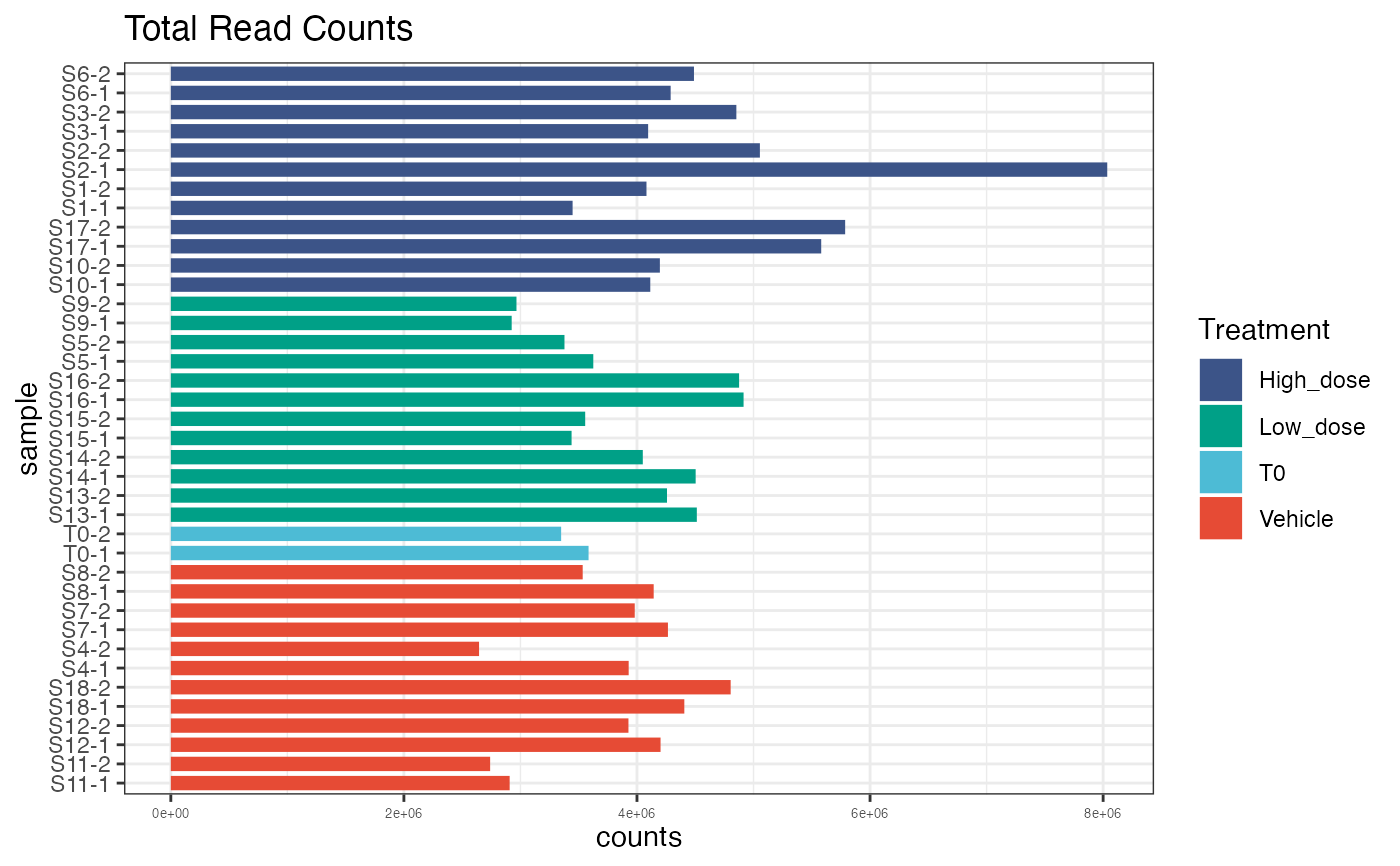
Plot sample read counts
plotReadCounts.RdSimple plot of total read counts per sample
Arguments
- dgeObject
DGEList object with barcode counts.
- group
Optional, column name in sample metadata to group samples by (string).
- log10
log10 transform output (boolean). Default = `FALSE`.
- legend
Include legend (boolean). Default = `TRUE`.
- order
Order samples by group (boolean). Default = `TRUE`.
Examples
data(test.dge)
plotReadCounts(test.dge, group = "Treatment")