plotOrderedBubble
plotOrderedBubble.RdGenerate ordered proportional bubbleplots from raw count object with barcodes labelled above a specified threshold
Usage
plotOrderedBubble(
  dgeObject,
  title = "Proportional Bubble Plot",
  orderSample = NULL,
  group = NULL,
  displaySamples = NULL,
  displayBarcodes = NULL,
  proportionCutoff = 10,
  colorDominant = FALSE,
  filterCutoff = NULL,
  labelBarcodes = TRUE,
  legend = TRUE,
  pseudoCount = FALSE
)
Arguments
- dgeObject
DGEList object with barcode counts.
- title
Plot title (string). Default = `Proportional Bubble Plot`.
- orderSample
Name of sample to order by (string).
- group
Optional, column name in sample metadata to group samples by (string).
- displaySamples
Optional, vector of samples to display - keep the order of vector.
- displayBarcodes
Optional, vector of barcodes to display.
- proportionCutoff
barcodes represented at a percentage within any sample above this threshold will be labelled (decimal). Default = `10`.
- colorDominant
Only color clones with frequency above `proportionCutoff` and others grey (boolean). Default = `FALSE`.
- filterCutoff
Barcodes below this threshold in `orderSample` will be filtered in all samples (boolean). Default = `TRUE`.
- labelBarcodes
Label barcodes with a proportion larger than proportionCutoff in any sample (boolean). Default = `TRUE`.
- legend
Show a legend of bubble sizes (boolean). Default = `TRUE`.
- pseudoCount
Whether to add a pseudo count of 1 to all counts to display barcodes absent in T0 (boolean). Requires counts to be normalized. Default = `FALSE`.
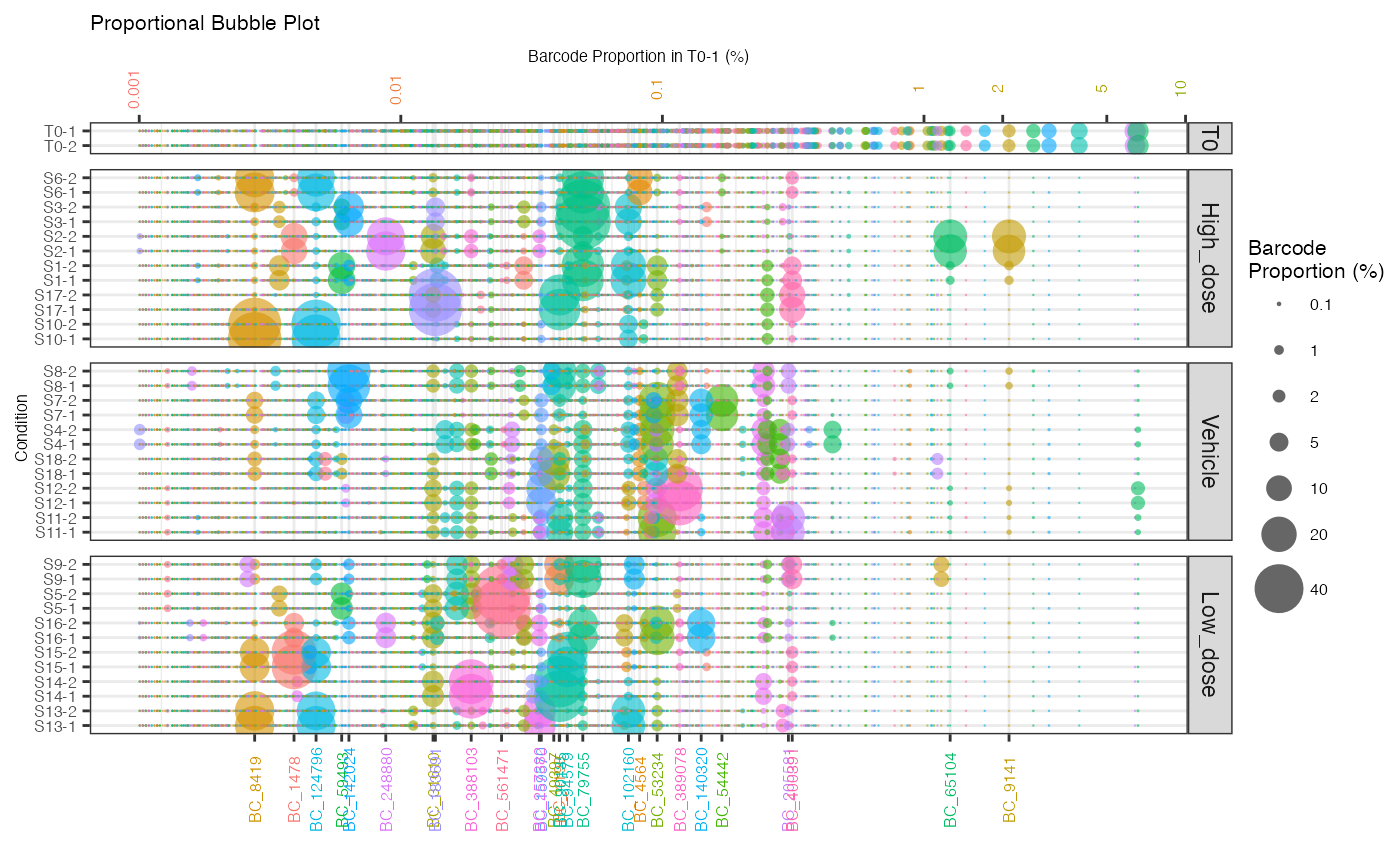
Examples
data(test.dge)
plotOrderedBubble(test.dge, orderSample = "T0-1", filterCutoff = 0.001, group = "Treatment")
#> Warning: Vectorized input to `element_text()` is not officially supported.
#> ℹ Results may be unexpected or may change in future versions of ggplot2.