Plot diversity indices across barcode samples
plotDivIndexes.RdPlots a dataframe of diversity indices per sample
Arguments
- dgeObject
DGEList object with barcode counts.
- div
Optional, precomputed diversity metrics calculated by `calcDivIndexes()`.
- metric
Diversity metric to plot (string). One of "shannon", "simpson", "invsimpson" or "gini". Default = `shannon`.
- type
Plot as bar, point or box plot (string). Default = `bar`.
- group
Optional, column name in sample metadata to group samples by (string).
Examples
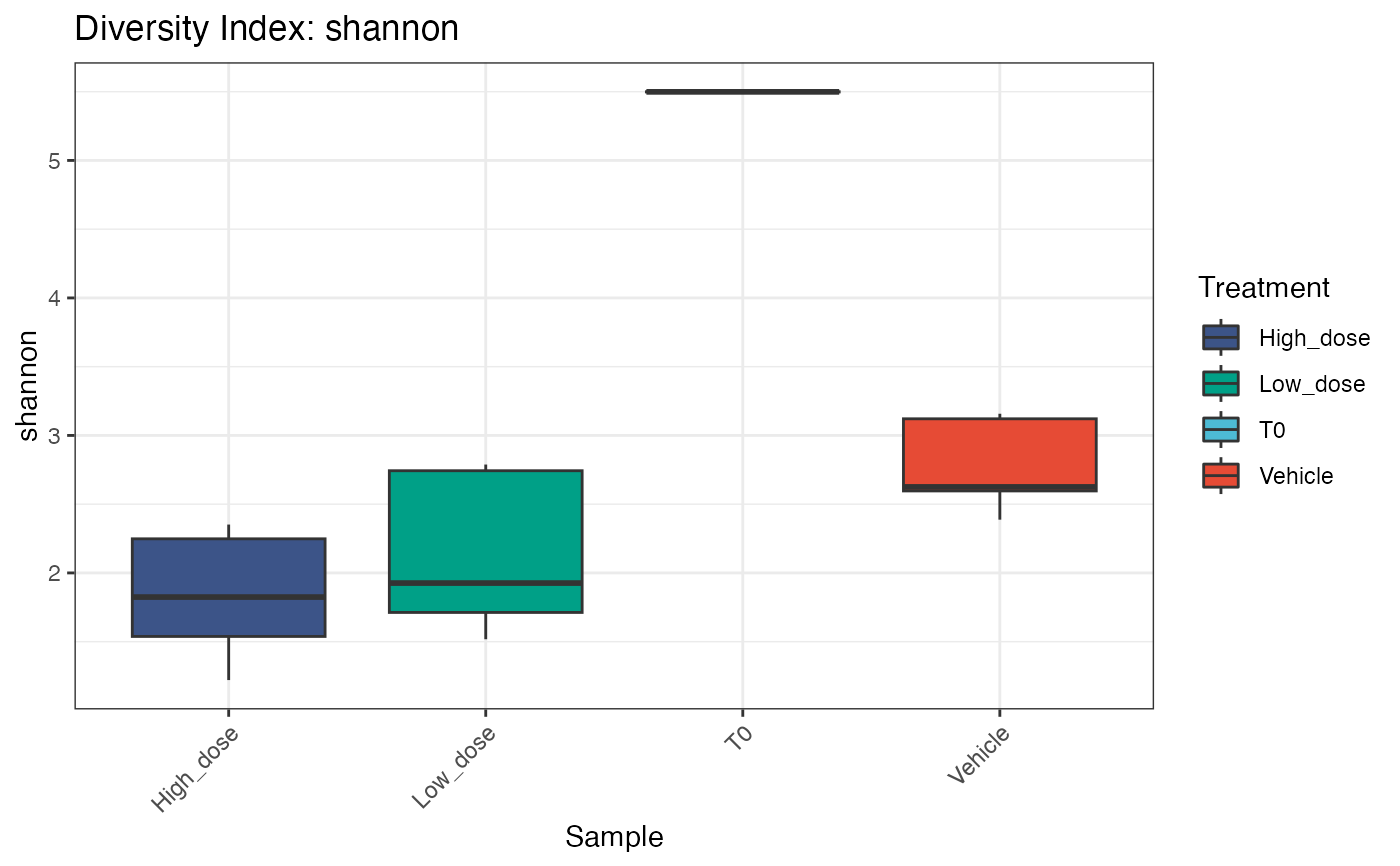
data(test.dge)
plotDivIndexes(test.dge, group="Treatment", type="box")