plotBarcodeTimeseries
plotBarcodeTimeseries.RdGenerate proportional timeseries plot from raw / normalised barcode count object.
Arguments
- counts
dataframe containing raw counts of barcodes
- name
desired plot title
- seed
RNG seed
- top
number of top barcodes per sample to plot
Examples
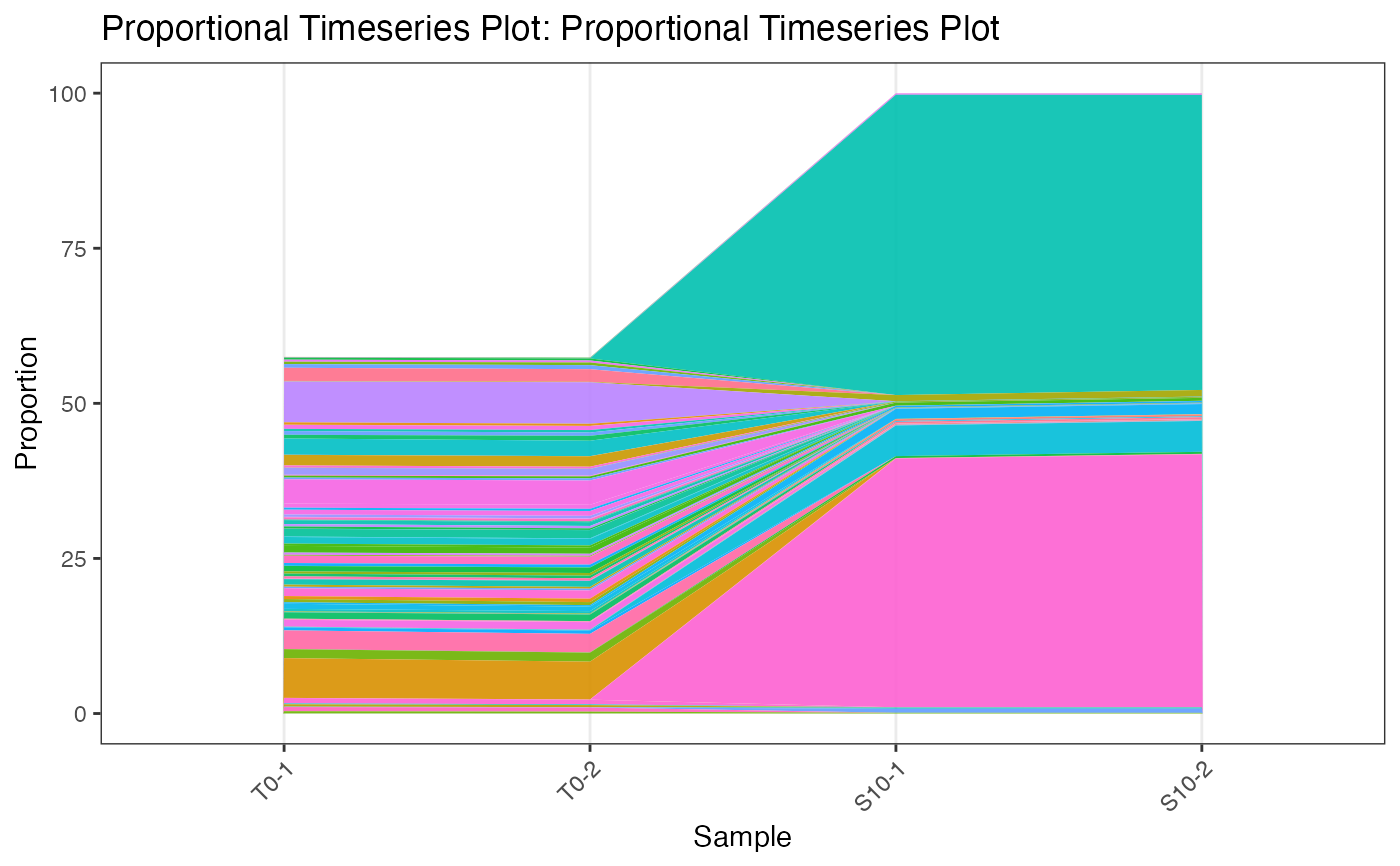
data(test.dge)
plotBarcodeTimeseries(test.dge[,1:4], name = "Proportional Timeseries Plot", seed = 5)
#> Using barcode as id variables