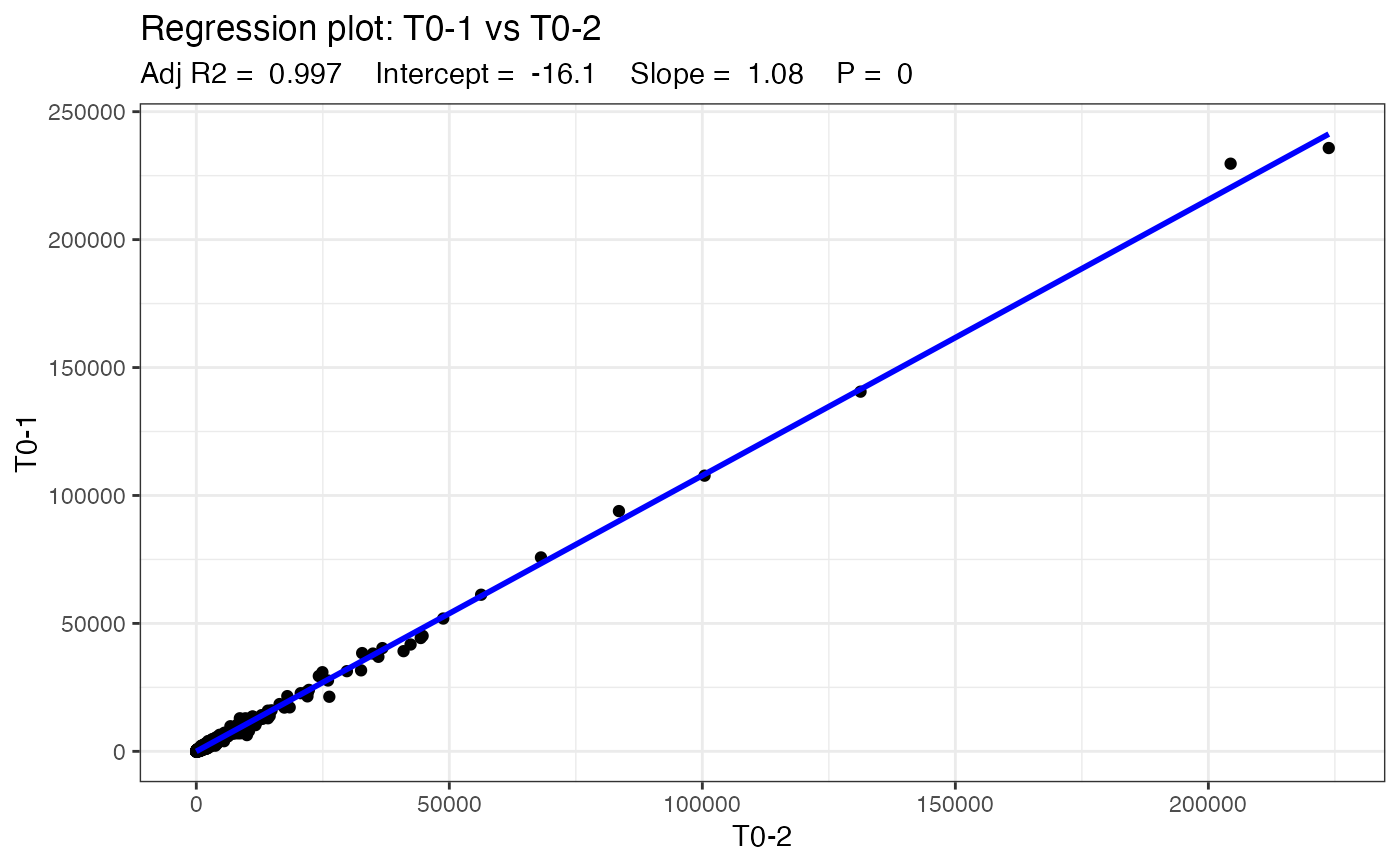
plotBarcodeRegression
plotBarcodeRegression.RdGenerate a linear regression scatterplot for two sets of sample counts.
Usage
plotBarcodeRegression(
  dgeObject,
  sample1 = NULL,
  sample2 = NULL,
  title = NULL,
  trendline = TRUE,
  trans = NULL,
  rug = FALSE
)
Arguments
- dgeObject
DGEList object with barcode counts.
- sample1
Name of sample 1 (string).
- sample2
Name of sample 2 (string).
- title
Optional, title of plot (string).
- trendline
Include linear trendline using `stat_smooth()` (boolean). Default = `TRUE`.
- trans
Optional, the name of a transformation object or the object itself.
- rug
Include geom_rug density information on the axes (boolean). Defaule = `FALSE`.
Examples
data(test.dge)
plotBarcodeRegression(test.dge, sample1 = "T0-1", sample2 = "T0-2")