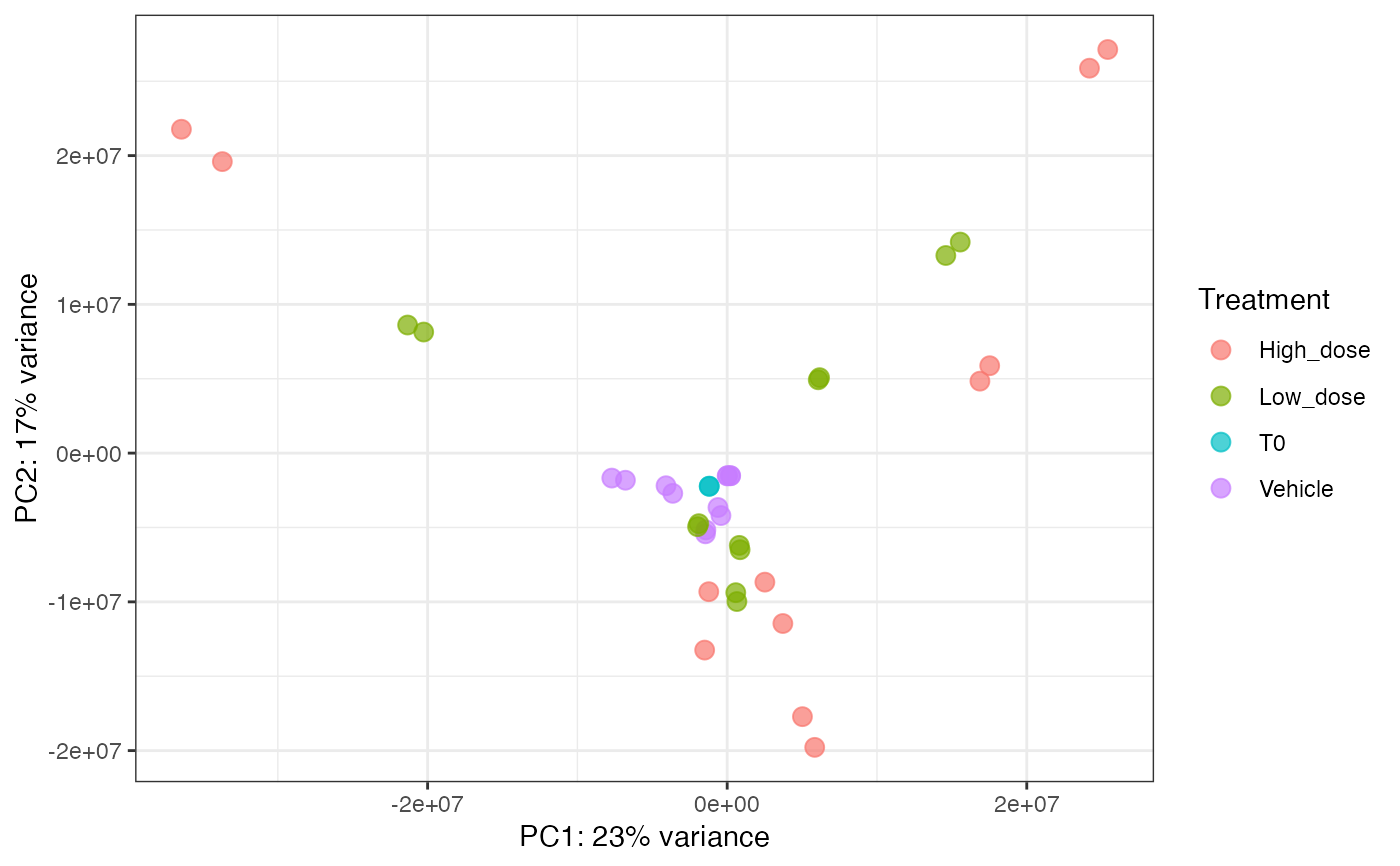
Barcode PCA plot
plotBarcodePCA.RdTakes a DGEList object contining barcode cpm counts and performs PCA. Then, plots the first two dimensions. Modified from DESeq2 package plotPCA function
Usage
plotBarcodePCA(
  dgeObject,
  groups = NULL,
  ntop = 500,
  returnData = FALSE,
  pcs = c(1, 2),
  batch = NULL
)
Arguments
- dgeObject
DGEList object with barcode counts.
- groups
Optional, one or multiple column names in sample metadata to color samples by (string or vector of strings).
- ntop
number of top most variable barcodes to be used in PCA calculation (integer). Default = `500`.
- returnData
Return a data.frame of PCA calculation instead of plot (boolean). Default = `FALSE`.
- pcs
Principle components to plot (vector of integers of length 2). Default = `c(1, 2)`.
- batch
Optional, metadata category indicating source of batch effects. Will be used in limma removeBatchEffect function prior to PCA.
Examples
data(test.dge)
plotBarcodePCA(test.dge, groups = "Treatment", ntop = 500, returnData = FALSE, batch = NULL)