plotBarcodeHistogram
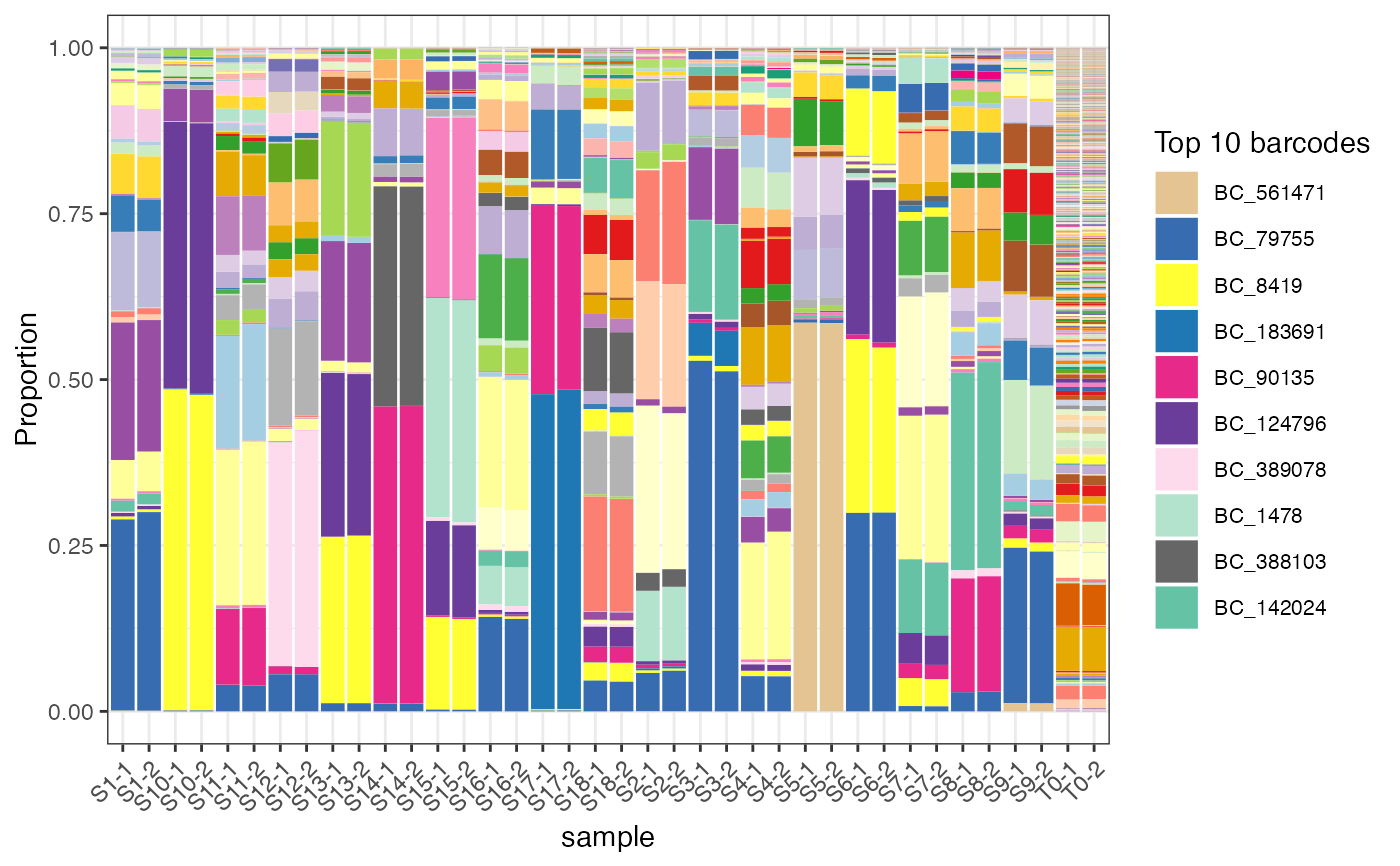
plotBarcodeHistogram.RdGenerate proportional stacked bar plot of barcodes from raw count object with n most frequent barcodes labelled.
Usage
plotBarcodeHistogram(
  dgeObject,
  topN = 10,
  seedColors = 1,
  samples = NULL,
  orderSamples = NULL,
  alphaLowFreq = 1
)
Arguments
- dgeObject
DGEList object with barcode counts.
- topN
Number of most frequent barcodes to show in legend (integer). Default = `10`.
- seedColors
Seed for sampling colors (integer). Default = `1`.
- samples
Samples to plot (vector of strings). Default all.
- orderSamples
One or multiple samples to order barcodes by (string or vector of strings). Default all.
- alphaLowFreq
Alpha of barcodes not in top n barcodes (decimal). Default = `1`.
Examples
data(test.dge)
plotBarcodeHistogram(test.dge)