Plot barcode heatmap
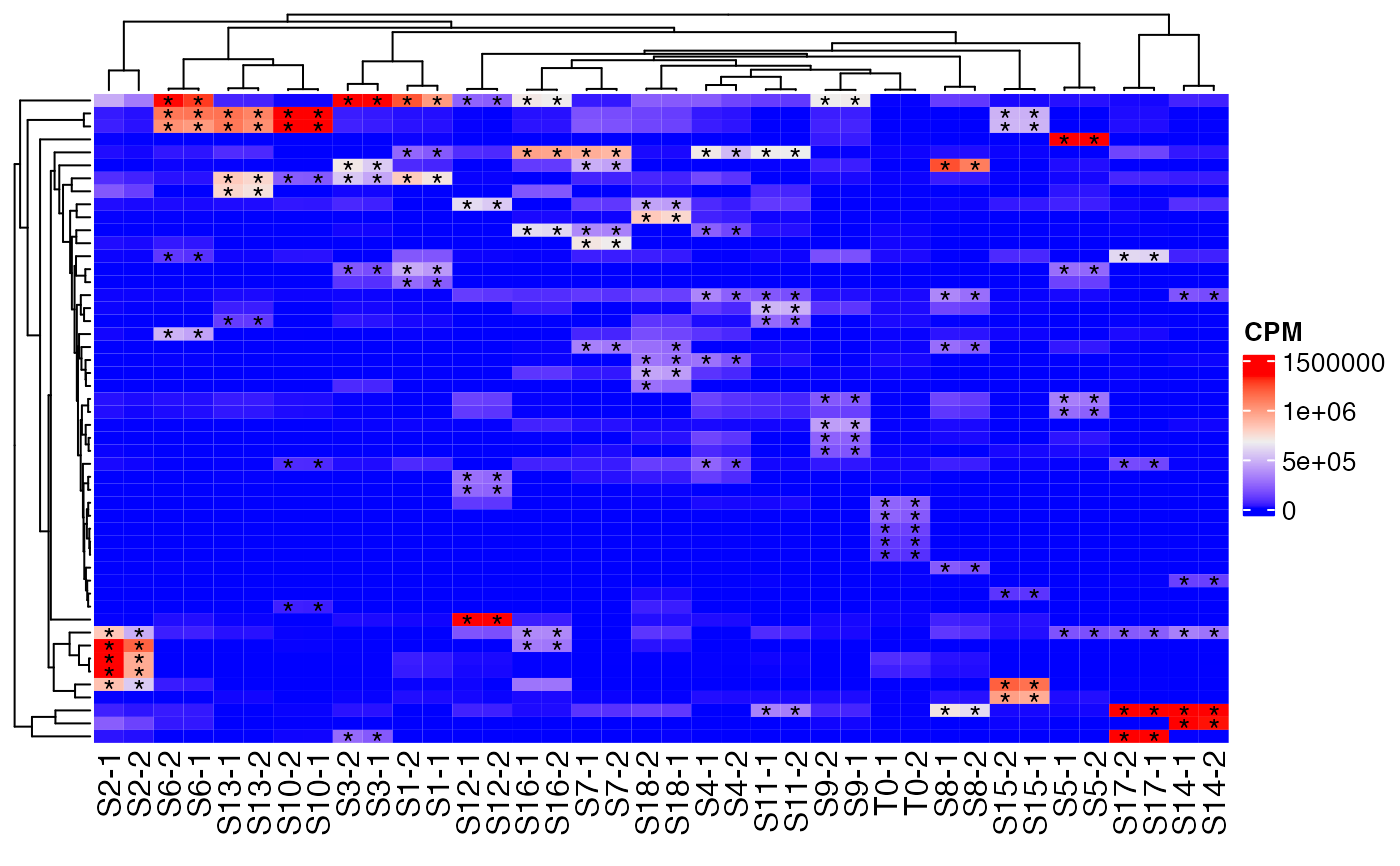
plotBarcodeHeatmap.RdTakes a DGEList with barcode counts, selects the n most abundant barcodes per sample and plots a heatmap. Stars indicate the most abundant barcodes in the respective sample.
Usage
plotBarcodeHeatmap(
  dgeObject,
  topN = 5,
  name = "CPM",
  showBarcodes = FALSE,
  group = NULL,
  colAnnot = NULL,
  discrete = FALSE,
  discreteThreshold = 1,
  labelTopBarcodes = TRUE
)
Arguments
- dgeObject
DGEList object with barcode counts.
- topN
Number of top barcodes per sample to show (integer). Default = `5`.
- name
String of the heatmap scale name (string). Default = `CPM`.
- showBarcodes
Show barcode names on the heatmap (boolean). Default = `FALSE`.
- group
Optional, column name in sample metadata to group samples by (string).
- colAnnot
List of vectors assigning colours to each level of metadata.
- discrete
Show presence/absence of barcodes instead of abundance (boolean). Default = `FALSE`.
- discreteThreshold
Threshold for presence of barcode in samples (decimal). Default = `1`.
- labelTopBarcodes
Label top barcodes within a sample (boolean). Default = `TRUE`.
Examples
data(test.dge)
plotBarcodeHeatmap(test.dge)