Sample to sample distances
plotBarcodeDistance.RdPlot sample distances between barcode sets / samples
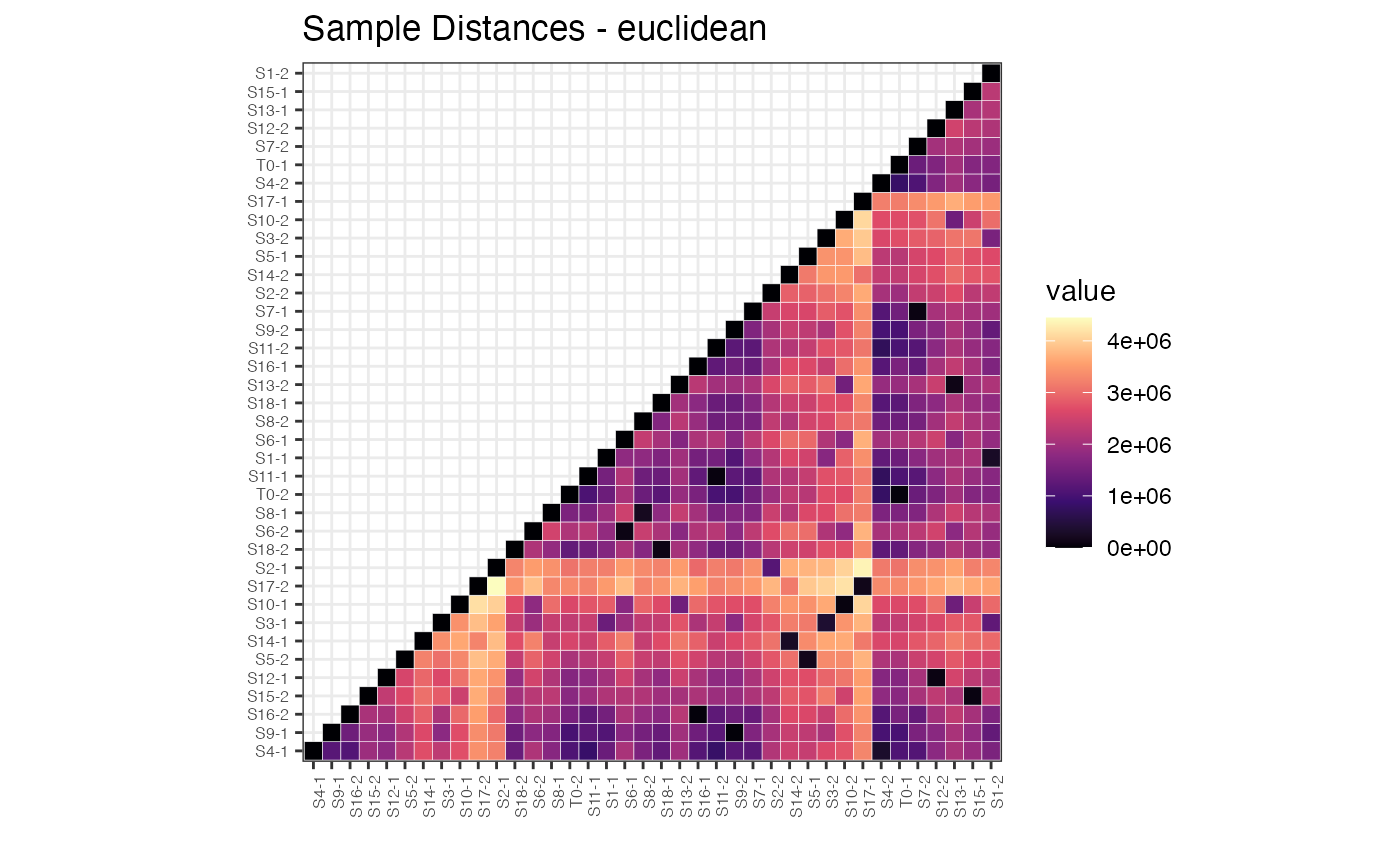
Plot sample distances between barcode sets / samples
Usage
plotBarcodeDistance(
  dgeObject,
  method = "euclidean",
  upper = TRUE,
  clustered = TRUE,
  title = "Sample Distances"
)

plotBarcodeDistance(
  dgeObject,
  method = "euclidean",
  upper = TRUE,
  clustered = TRUE,
  title = "Sample Distances"
)
Arguments
- dgeObject
DGEList object with barcode counts.
- method
Distance metric to use (string). One of "euclidean", "maximum", "manhattan", "canberra", "binary" or "minkowski". Refer to stats::dist for details. Default = `euclidean`.
- upper
Plot only the upper half of the matrix (boolean). Default = `TRUE`.
- clustered
Cluster rows and columns of matrix (boolean). Default = `TRUE`.
- title
Title of plot (string). Default = `Sample Distances - method`.
- counts
matrix/dataframe containing raw or normalised counts
- name
title of plot
Value
Returns a heatmap of sample distances using desired clustering
Returns a heatmap of sample distances using desired clustering
Examples
plotBarcodeDistance(test.dge$counts)
#> Error in plotBarcodeDistance(test.dge$counts): Please supply a valid DGEList object as input
data(test.dge)
plotBarcodeDistance(test.dge)