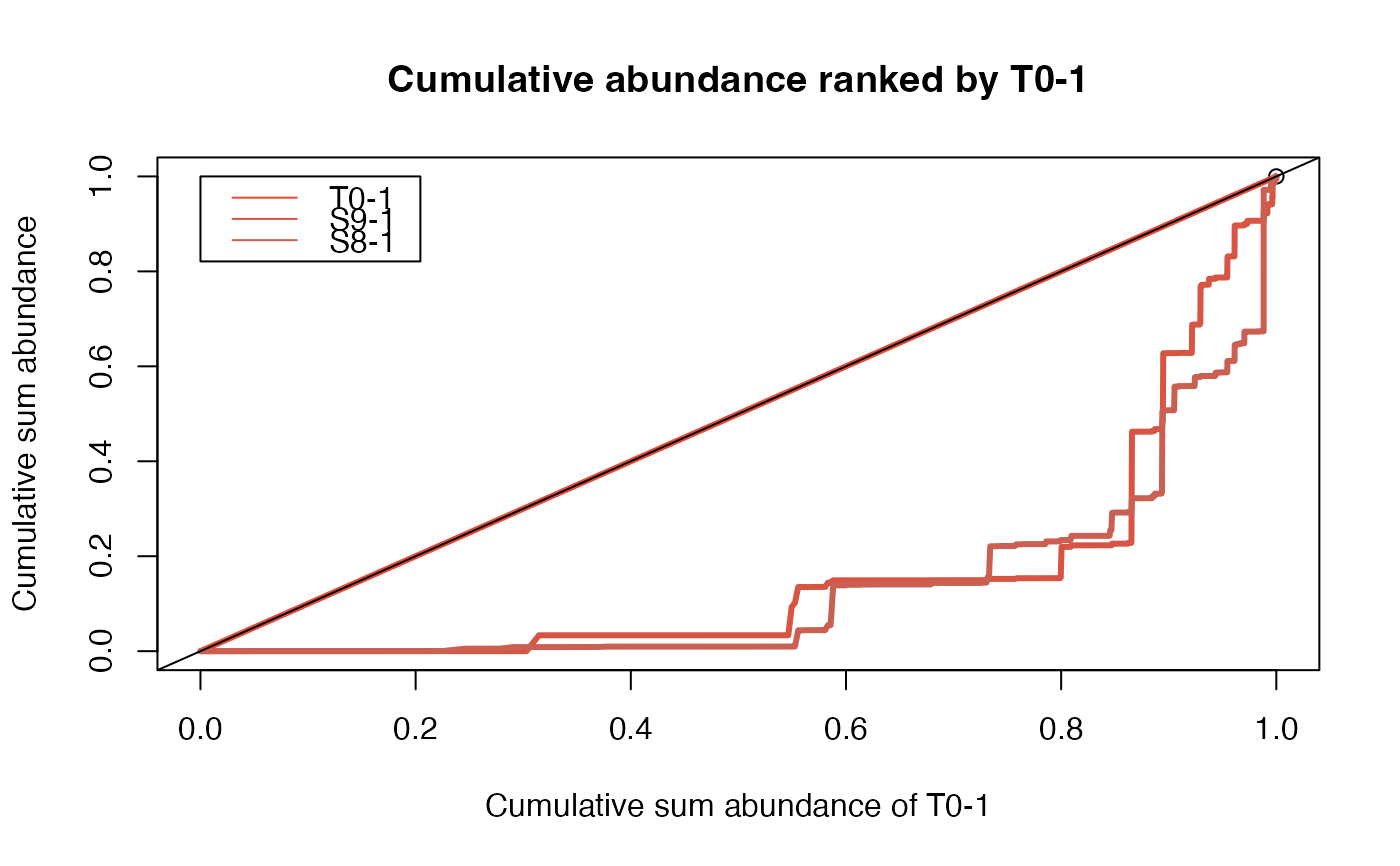
Barcode cumulative sum plot of a list of samples against and ordered by reference sample
plotBarcodeCumSum.RdTakes a dataframe of the barcode cpm counts, calculate the relative abundance of each barcode in each sample. Then, barcodes of all samples are ordered for the reference sample in decreasing order and the cumulative sum is calculated for each sample. Cumulative sum is then plotted against the reference sample
Arguments
- dgeObject
DGE object containing CPM counts
- referenceSample
sample to compare others against
- samples
vector of sample names to be plotted against reference sample