Sample to sample correlation
plotBarcodeCorrelation.RdPlot sample correlation between barcode sets / samples
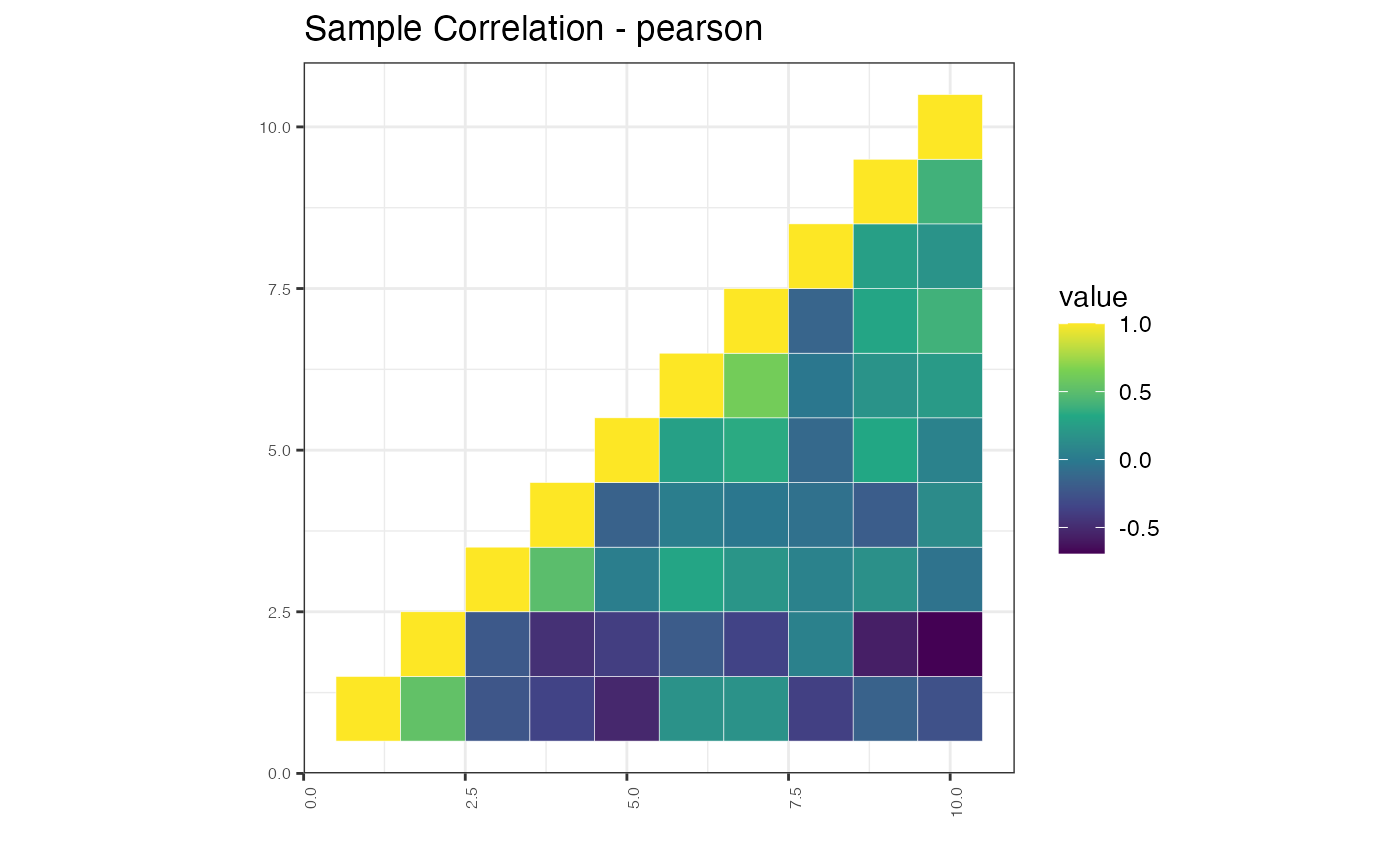
Plot sample correlation between barcode sets / samples
Usage
plotBarcodeCorrelation(
  counts,
  method = "pearson",
  upper = T,
  clustered = T,
  name = "Sample Correlation"
)

plotBarcodeCorrelation(
  counts,
  method = "pearson",
  upper = T,
  clustered = T,
  name = "Sample Correlation"
)
Arguments
- counts
matrix/dataframe containing raw or normalised counts
- method
correlation metric to use. Refer to stats::cor for available options
- upper
Logical. plot only the upper half of the matrix
- clustered
Logical. cluster rows and columns of matrix
- name
title of plot
- dgeObject
DGEList object with barcode counts.
- title
Title of plot (string). Default = `Sample Correlation - method`.