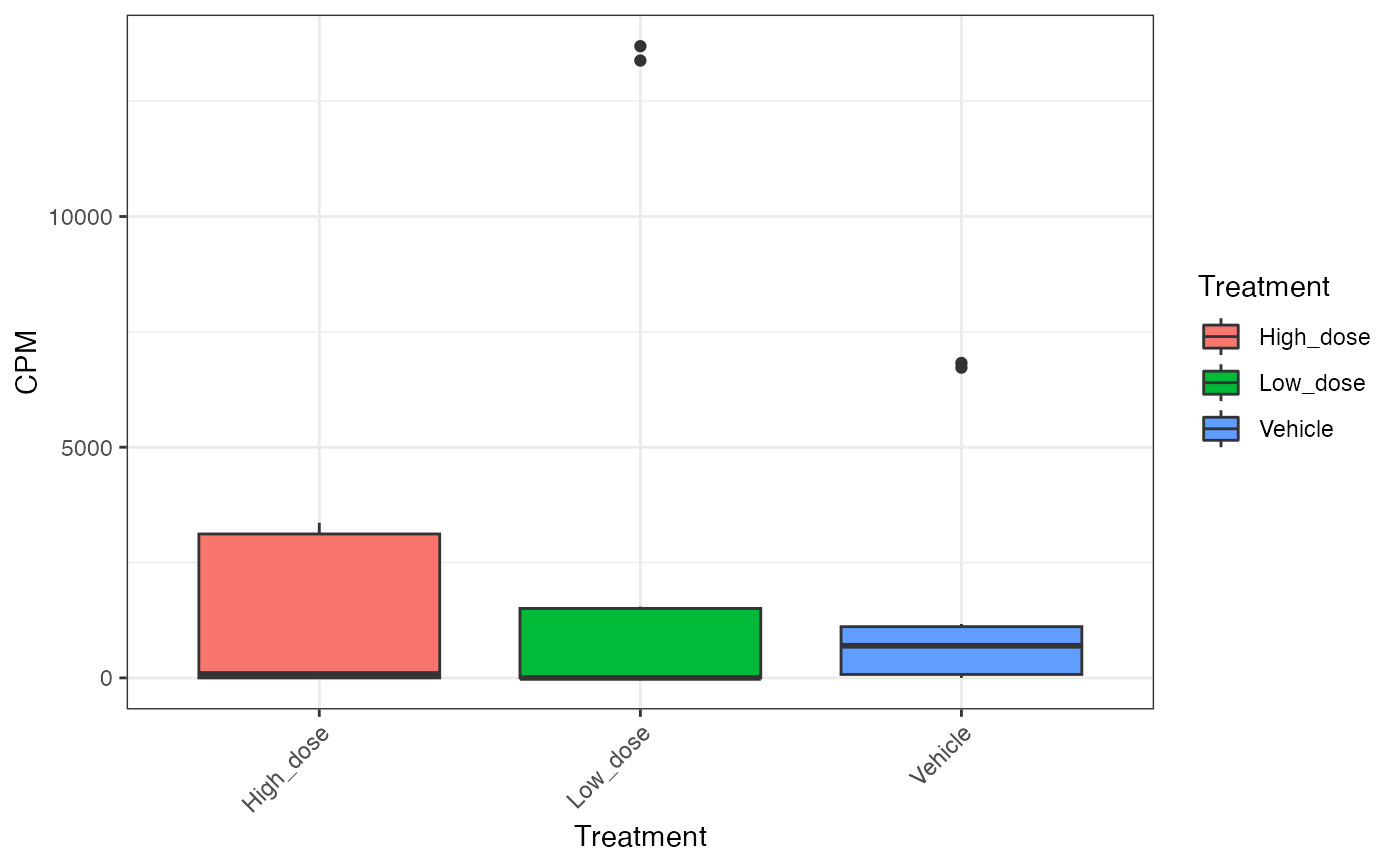
Boxplot of selected barcodes
plotBarcodeBoxplot.RdPlots boxplot of counts for selected barcodes from DGEList object.
Usage
plotBarcodeBoxplot(
  dgeObject,
  barcodes = NULL,
  group = NULL,
  conditions = NULL,
  trans = NULL,
  point = FALSE,
  violin = FALSE,
  returnData = FALSE,
  normalizeMethod = "CPM"
)
Arguments
- dgeObject
DGEList object with normalized barcode counts.
- barcodes
Barcodes to be plotted (vector of strings).
- group
Optional, column name in sample metadata to facet data on (string).
- conditions
Optional, specific levels of group to be plotted (vector of strings).
- trans
Optional, transformation of y-axis, e.g. `log10` (string).
- point
Whether to include points (boolean). Default = `FALSE`.
- violin
Whether to include violin plots in addition to box plots (boolean). Default = `FALSE`.
- returnData
Whether to return data instead of plot (boolean). Default = `FALSE`.
- normalizeMethod
Method for normalizing counts (string). One of `CPM`, `TMM`, `TMMwsp`, `upperquartile`, `RLE` or `NULL` for no normalization. See `edgeR::calcNormFactors()`. Default = `CPM`.