Barcode abundance comparison
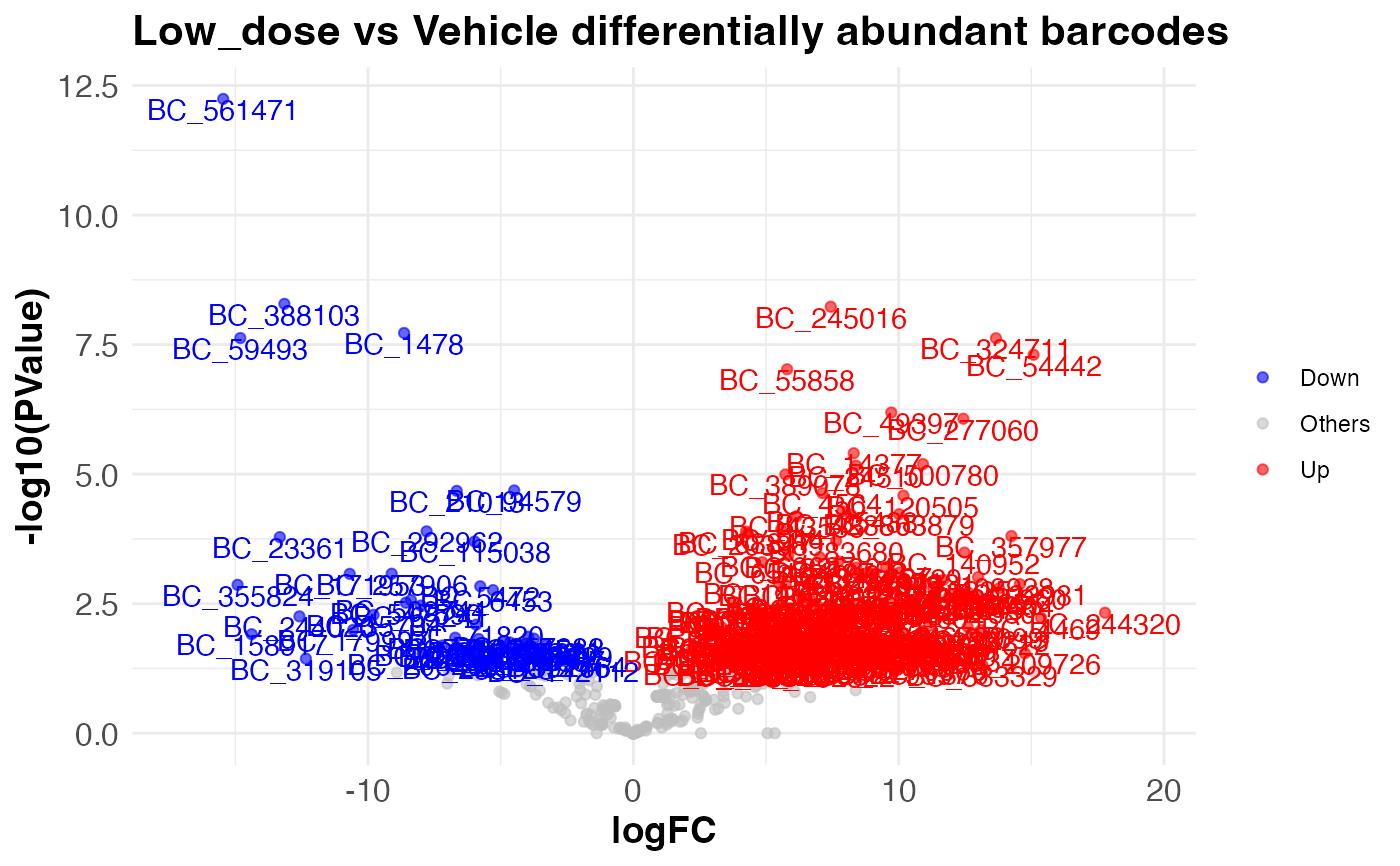
compareAbundance.RdTakes a DGElist list object with counts and samples dataframe. Finds differentially abundant barcodes between two experimental conditions, using the likelihood ratio test (LRT) based on the fitted generalized linear model (GLM) to compare two nested models, typically a reduced model and a full model, to determine if the additional terms in the full model significantly improve the model fit. Additionally, it computes the p-values associated with the test statistic for each barcode. It save the results in a csv file and returns a volcano plot.
Usage
compareAbundance(
  dgeObject,
  group,
  condition1,
  condition2,
  pval = 0.05,
  logFC = 2,
  filename = NULL
)
Arguments
- dgeObject
DGEList object with barcode counts.
- group
Column name in sample metadata to group samples by (string).
- condition1
Name of reference condition in group column (string).
- condition2
Name of second condition in group column (string).
- pval
Pvalue threshold for the volcano plot (decimal). Default = `0.05`.
- logFC
logFC threshold for the volcano plot (decimal). Default = `2`.
- filename
Optional, filename for the results of the likelihood ratio test (string).
Examples
data(test.dge)
compareAbundance(test.dge, group = "Treatment", condition1 = "Vehicle", condition2 = "Low_dose")